



Single tariff
A site that only buys from the grid.
It reads
- Live kW, kWh today, kWh this month
- The peak versus off-peak split, hour by hour
- Voltage, current and power factor on each phase
In service today
Paper mill · Kasur
A factory can run on the grid, its own solar and a generator — all at once — and still get one number a month it can’t explain. WattEY reads all three every three minutes and turns raw meter data into a billable, traceable picture of where the electricity came from and when it was used. I built it.
Ali AhmedProduct · Data · EngineeringHead of Product & Platforms · BijliBachao.pkLive since November 2025 · figures as of August 2026Private industrial system — not publicly accessibleAuditable, source-measured data
43
Meters
19
Organisations
14
Industries
635.76kW
Peak load recorded
~156K
Measurements / day
Where the load came from
illustrative
grid net of solar export · generator kept apart · split illustrative
Alerts (Live)
Fleet load · last 24h
illustrative shape
Billing intelligence
3sources, separated
the time-of-use split, grid net of solar export, and the generator costed apart — computed automatically.
WattEY produces the billable number; the tariff is the client’s.
Across 14 industries
Mills, farms, hotels, malls and factories on multiple power sources.
Built at
BijliBachao.pk
an engineering design house that builds its own software — not an installer
In production
9 months, continuous
live since November 2025 · one of the world’s hardest energy markets
Across the fleet
Mills · hotels · malls · farms
Lahore · Sheikhupura · Kasur · Sargodha · Kamoke
Started
1opaque figure / month
A director’s bill was one page a month — no way to say which shift, which source, or which hour drove the cost.
Built
16values · every 3 min
A three-phase meter reporting sixteen values every three minutes, classifying each meter from its own telemetry.
Delivered
3sources, separated
Billing-grade accounting: time-of-use, grid import net of solar export, and generator kept separate — automatically.
Scaled
43meters · 19 orgs
Rolled across a live fleet — grid collapse, a rooftop-solar boom and diesel generators, all at once.
Outcome
1.92GWh accountable
Every unit now attributable to its source and its shift — a figure a CFO can take to the board.

01The problem
Factories, mills and large facilities run on multiple power sources — grid, solar and a generator — and still get one confusing bill every month.
No one on site can tell you which shift, which source, or which hour actually drove the cost.
It’s not a lack of data. It’s a lack of the right intelligence.
Grid
Import
Solar
Import / Export
Generator
Fuel cost
Meter
reading
Meter
reading
Meter
reading
Monthly bill
An illustration of a monthly bill; the amounts are deliberately unreadable because no real rupee figure is published.
This uncertainty is expensive.
Every month of not knowing costs real money, hides waste, and makes decisions risky.
No source visibility
Can’t see what was used, when, or why.
No shift-level answer
The shift that drove the cost stays unknown.
Billing errors
Manual calculations lead to mistakes and disputes.
Cost keeps rising
Blind spots today become larger losses tomorrow.
No audit trail
No trusted record to justify the numbers.
The result with WattEY
Clarity. Accuracy. Control.
WattEY turns raw meter data from every source into the real number a business is billed on — split by time-of-use, net of solar export, and separated by source.
02The build
WattEY wasn’t a dashboard project. I designed and built the end-to-end industrial energy system that turns unreliable, multi-source meter data into a number a business can actually trust.
Ali Ahmed
Head of Product & Platforms
Raw data
From the physical world

3-phase smart meter
16 values every 3 minutes
Ingest & validate
Turn signals into reliable data
Secure transmission
Mobile / IoT connectivity
Normalization
Unified format & timestamps
Validation
Outlier detection & checks
Gap detection
Identify outages & issues
WattEY engine
The intelligence layer
Source classification
Grid / Solar / Generator
Time-of-use engine
Peak, off-peak, day, night
Solar netting logic
Import / export separately
Generator accounting
Runtime & energy tracking
Reconciliation
Make the numbers agree
Product layer
Actionable insights
Energy mix (today)
Peak vs off-peak
fleet average
Live power
742kWBusiness decision
Clarity that drives action
Know true cost
See what’s driving your bill.
Reduce waste
Find and fix the real problems.
Verify systems
Prove solar & generator performance.
Make decisions
With data you can actually trust.
One system.
Many decisions.
Built for real-world complexity
3-Phase
Industrial-grade
monitoring
16
Measurements
every 3 minutes
~156K
Measurements
processed daily
1.92 GWh
Energy measured
since Nov 2025
Honest by design
We show gaps.
We don’t guess.
Phone first
Because managers
use phones.
03The hard part
Most dashboards make gaps disappear. WattEY keeps them visible — because a complete-looking chart can still be a completely wrong story.
The actual event
Reporting
Data flowing every 3 min
Signal lost
Meter lost mobile signal
56.9 hours
No signal — nothing observed
2+ days later
Connection restored
On return
15,860 kWh arrives at once
The meter kept counting.We just couldn’t hear it.
Fills the gap. Looks complete.
Energy (kWh) · illustrative
But this chart is guessing what happened during the outage.
Shows the truth. No guessing.
Energy (kWh) · illustrative
We keep the total right. We don’t invent the timing.
What actually happened
The connection dropped
The meter lost mobile signal and stopped reporting for more than two days.
The meter kept counting
It kept accumulating energy internally — the link stopped, the metering did not.
15,860 kWh arrived at once
After 56.9 hours the whole backlog landed in a single reading on reconnection.
We kept the total
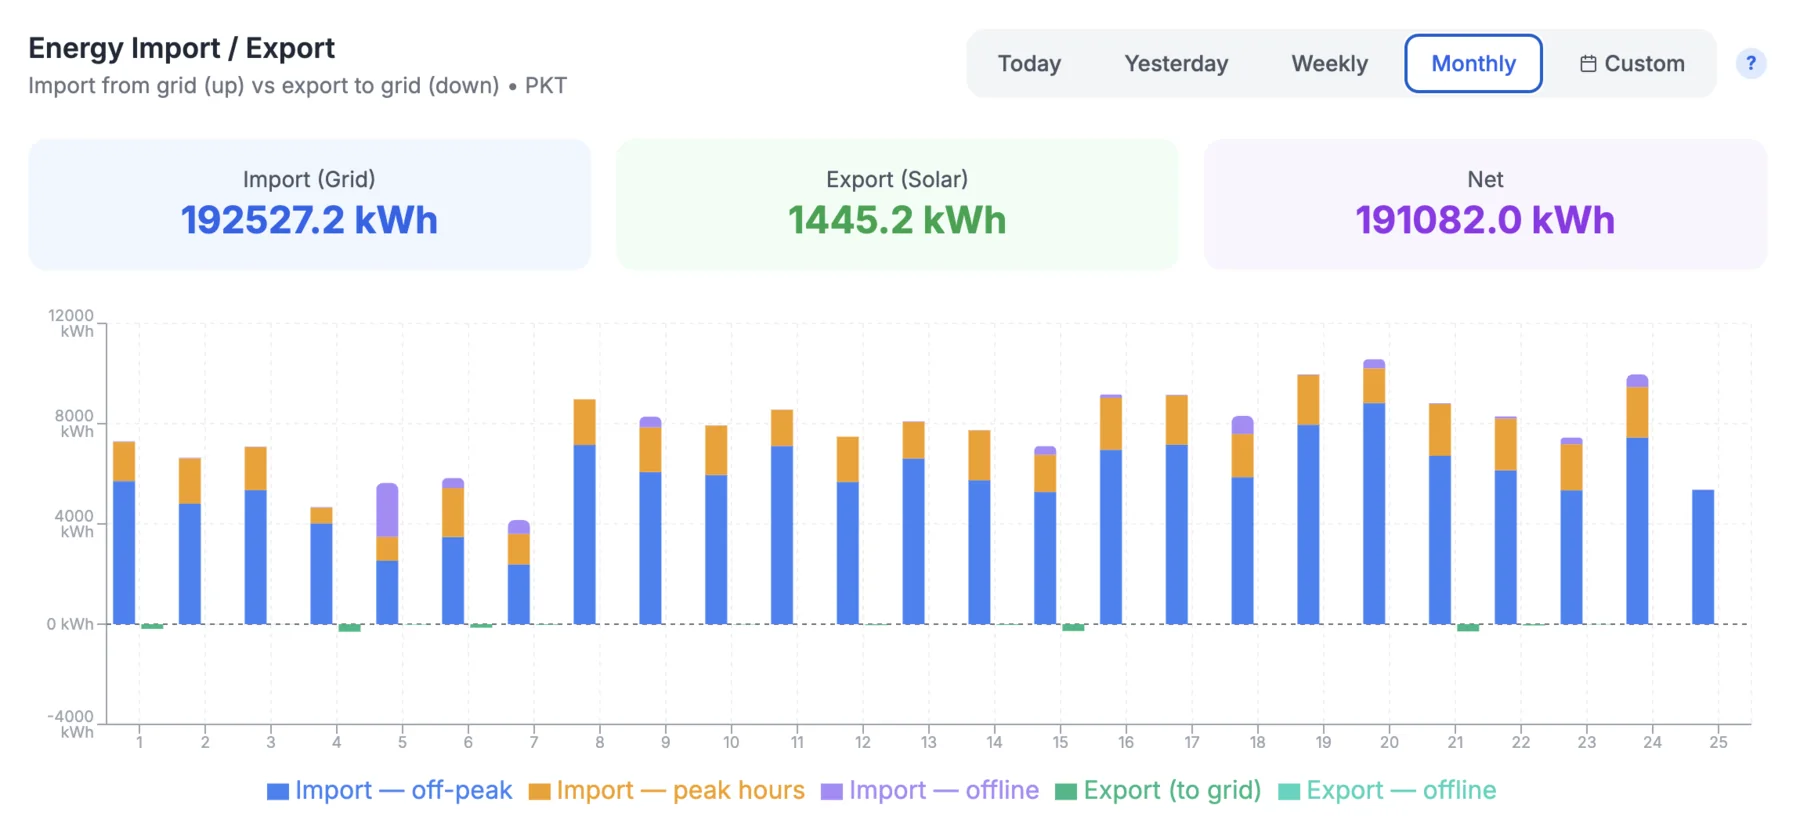
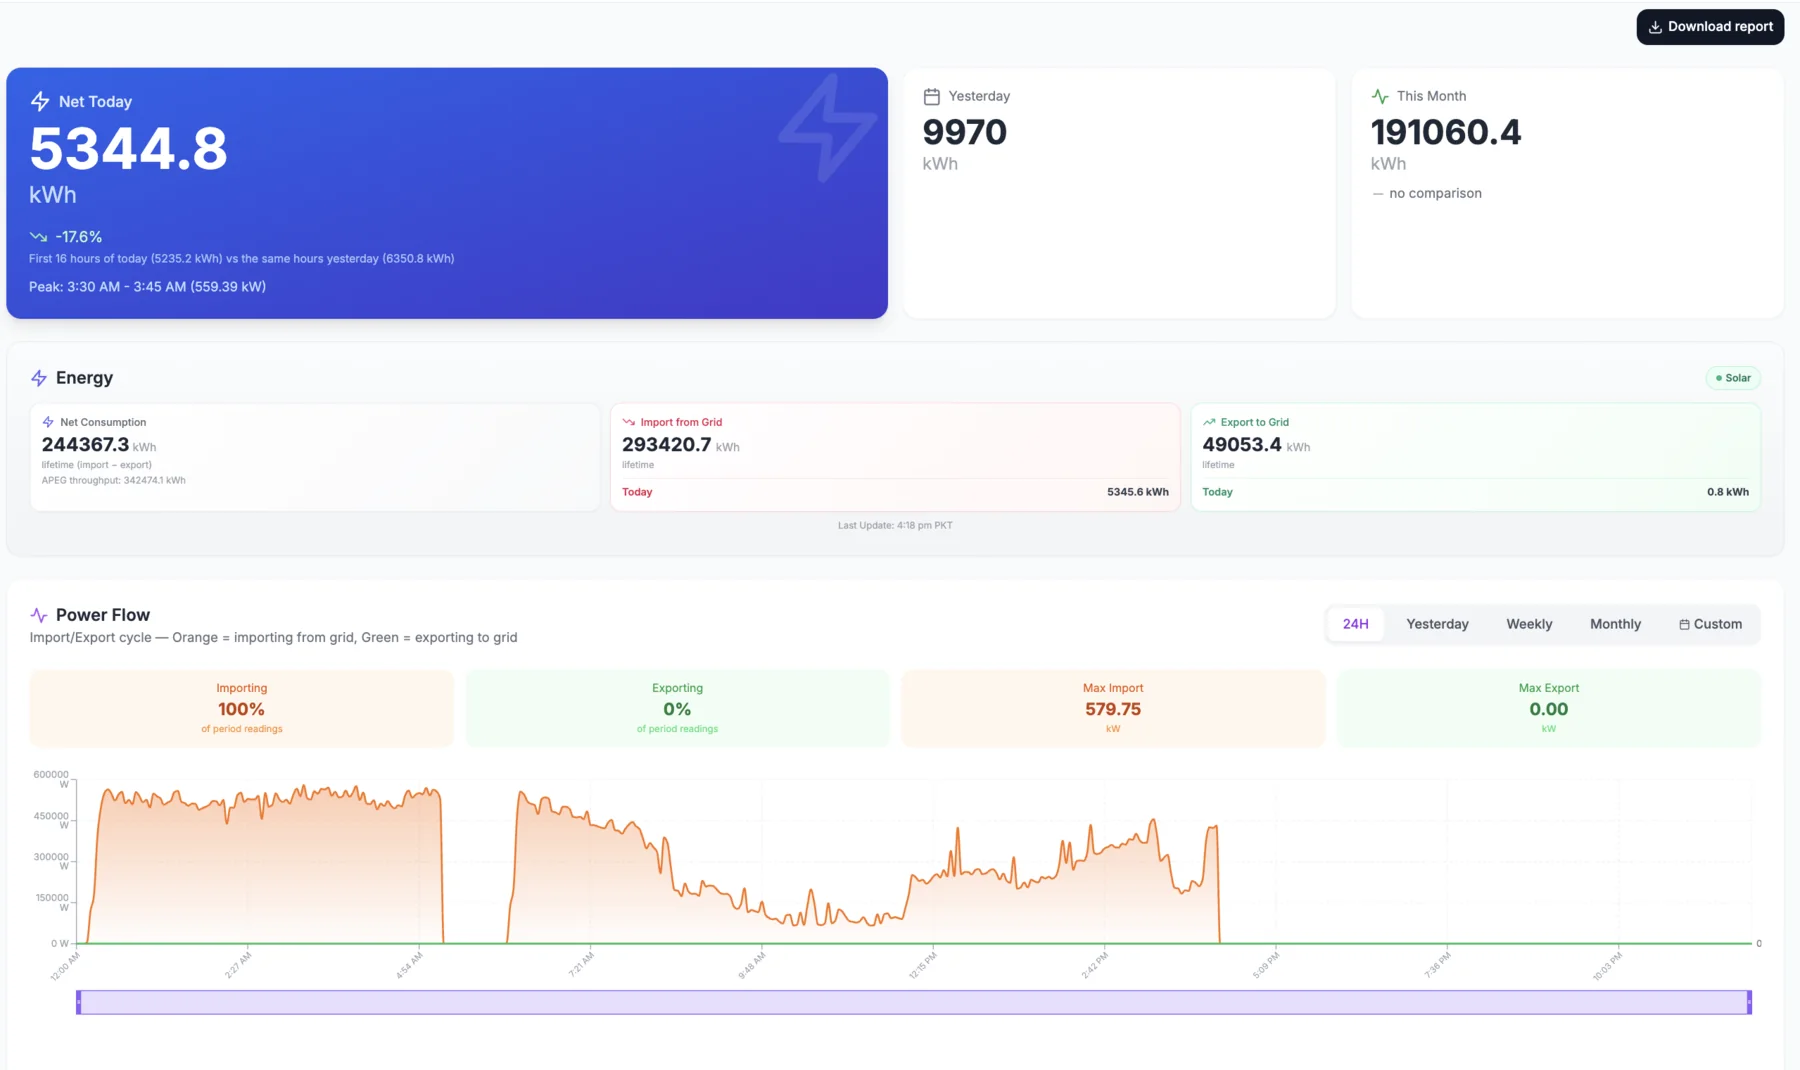
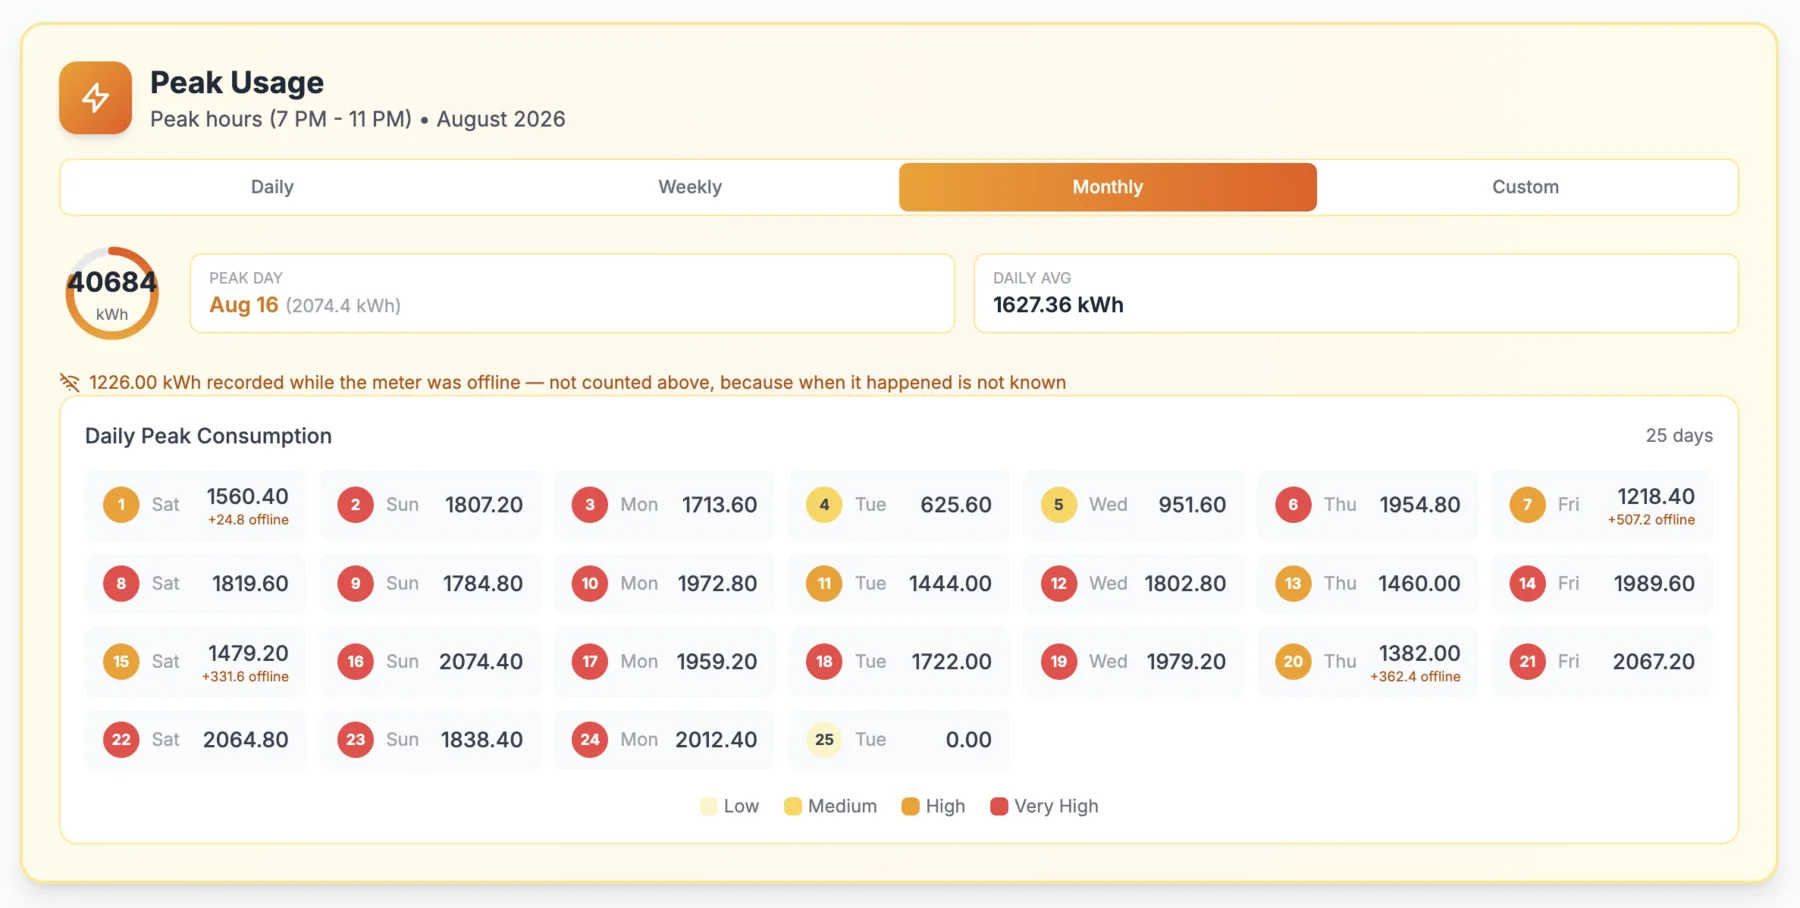
The energy is real and observed, so it stays in the total.
We excluded the timing
No time-of-use, peak or hourly split for a window nobody observed.
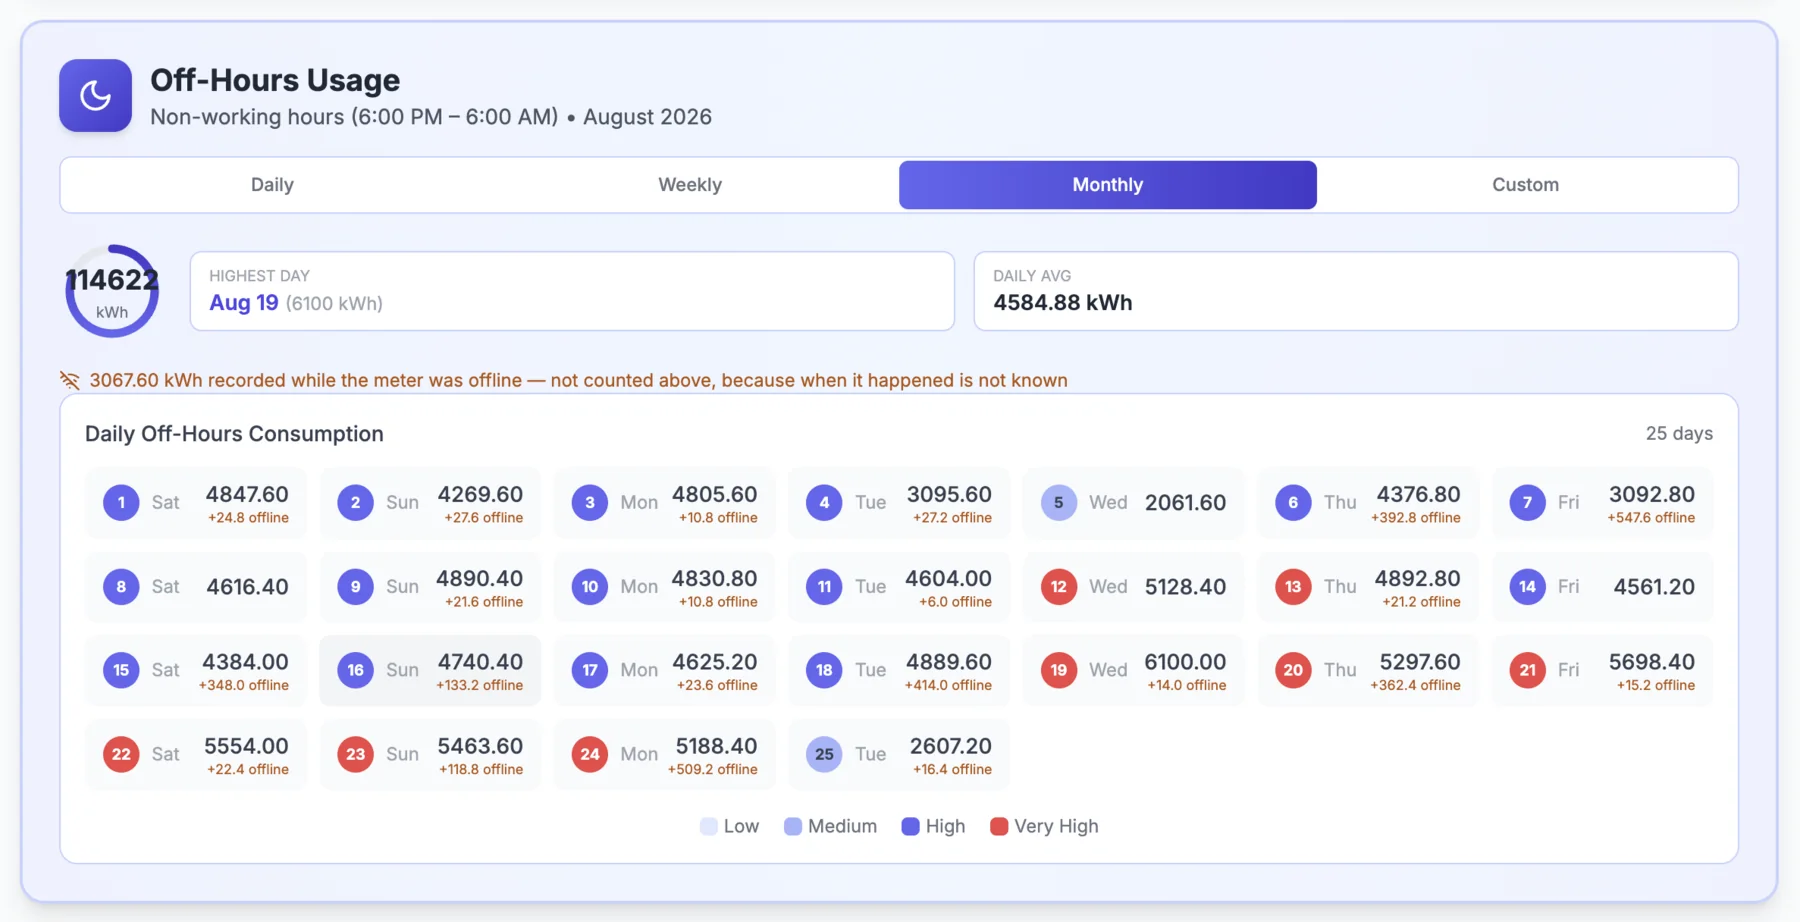
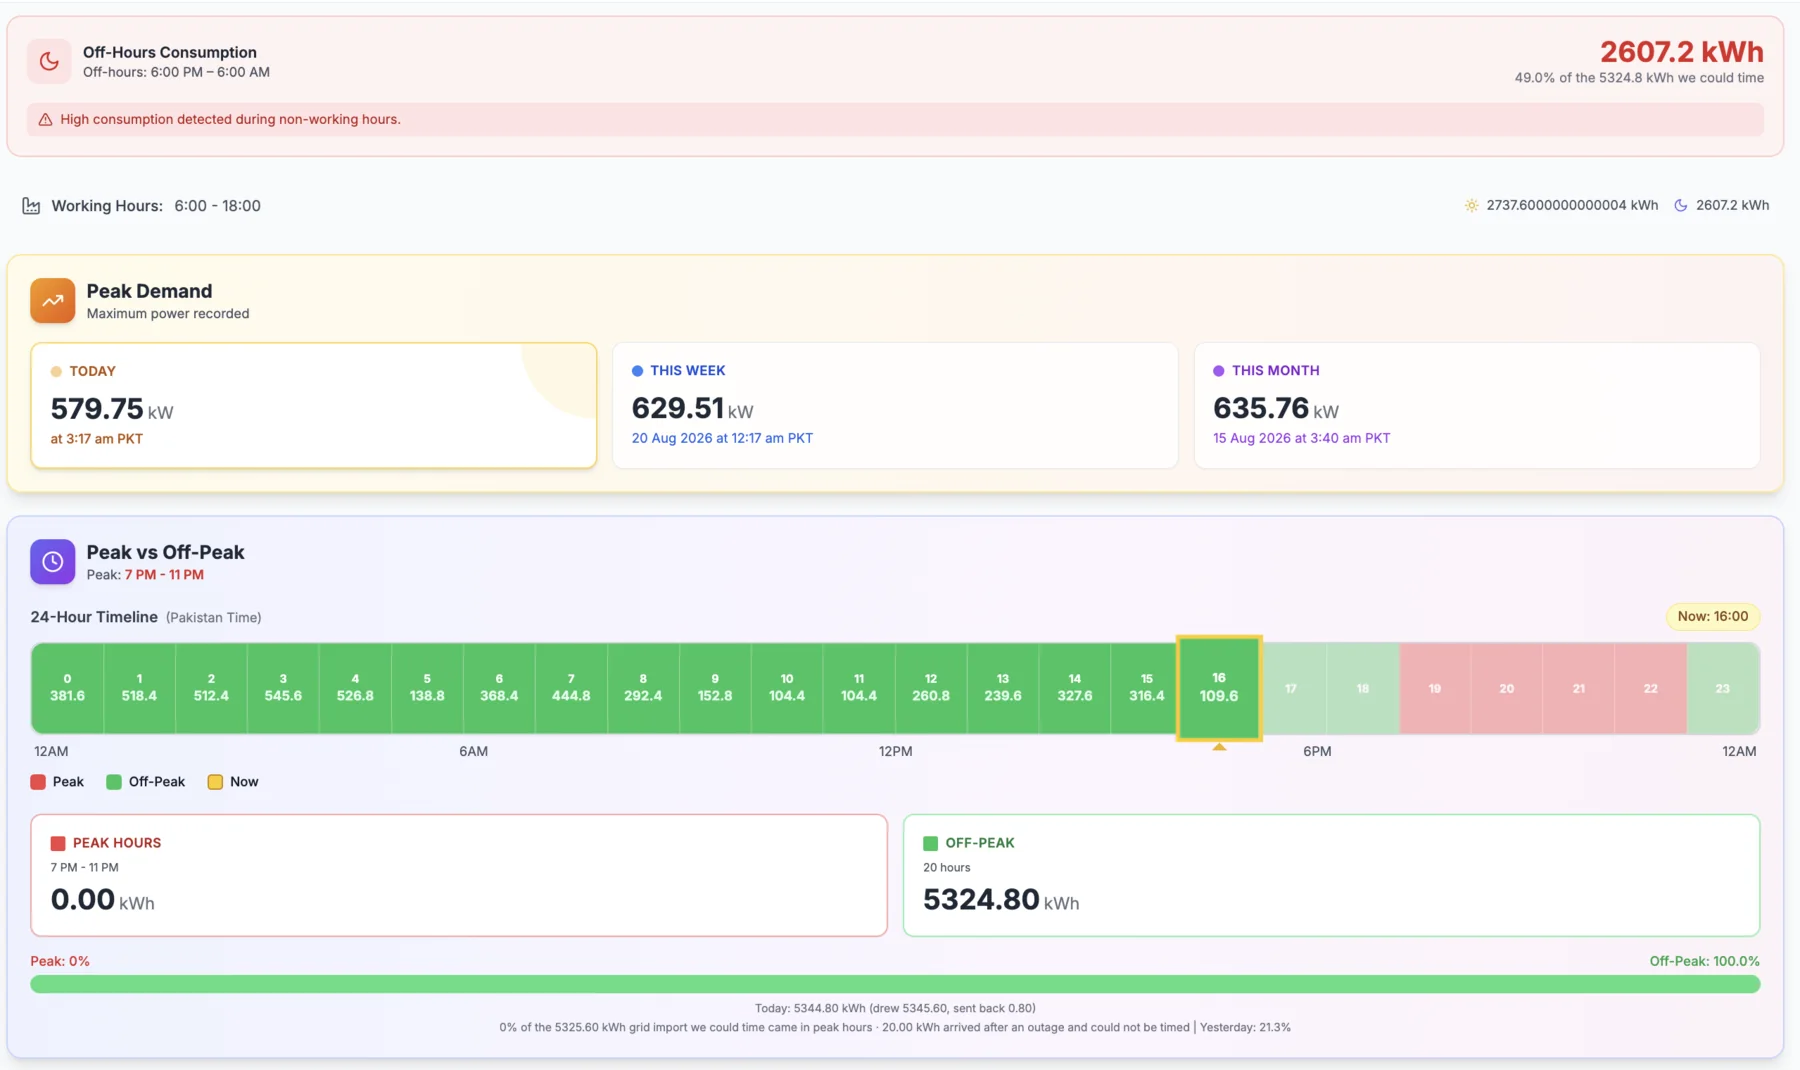
Not a diagram — the shipped product
Both screens report the offline energy, and then refuse to bill it to a window. The total stays right; the timing stays unclaimed.


The hard part wasn’t collecting another reading. It was deciding what we were allowed to claim about the readings we didn’t get.
A total can be correct while the story is wrong.
WattEY is designed to know the difference.
Data completeness
Every observed reading counted; every gap left visible.
Gaps are visible by design.
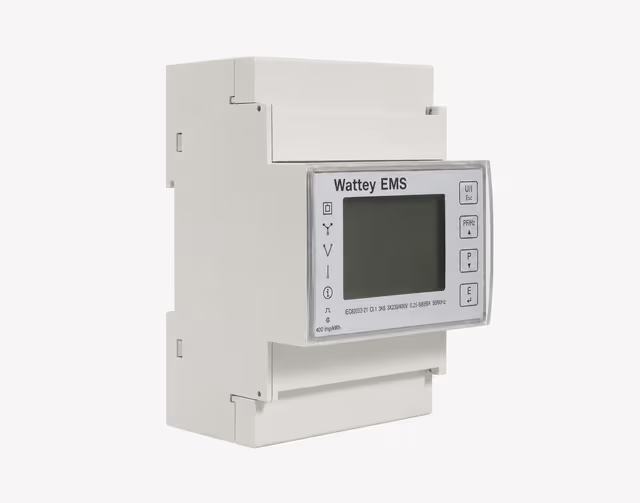
An industrial site can run on the grid, on its own roof and on a diesel generator, switching between them through the day. WattEY works out which of the three a meter is watching from the telemetry itself — not from an installer’s note that goes stale the first time somebody adds panels. That was the harder thing to build, and the right one: the class stays correct with nobody maintaining it, and each class sees everything the class below it sees, and more.
A site that only buys from the grid.
It reads
In service today
Paper mill · Kasur
A site whose roof exports back to the grid.
Everything in 1T, and
In service today
Dairy farm · Sargodha
A site running all three sources through one day.
Everything in SM, and
In service today
Hotel · Lahore
Two pieces of arithmetic separate a meter reading from the number on the bill. One is the clock; one is a minus sign. Getting both right — automatically, as the rules and the seasons change — is the difference between a monitor and a bill.


Peak-hour electricity is billed at a higher rate than off-peak, and the window that decides which hours count is not fixed. It shifts four times a year, and WattEY moves with it automatically — so the split it reports is the one the tariff is computed on, rather than an approximation someone has to remember to update.
| Season | Months | Peak window |
|---|---|---|
| Winter | Dec – Feb | 5 PM – 9 PM |
| Spring | Mar – May | 6 PM – 10 PM |
| Summer | Jun – Aug | 7 PM – 11 PM |
| Autumn | Sep – Nov | 6 PM – 10 PM |
A monitor that reports only total consumption cannot tell a director which shift to move. Splitting the day at the right hour, in the right month, is what makes the reading actionable.
When a roof sends more to the grid than the building draws, consumption for that hour is negative. WattEY tracks import and export as two separate quantities and reports the difference — the same subtraction the net-metering bill performs.
kWh · illustrative
kWh · illustrative
kWh · illustrative
Net consumed = import − export = 14,873 kWh
illustrative example
Source · Rates and windows are those observed across WattEY’s own client sites, as of August 2026. Tariffs are set by the distribution companies and change; the figures are illustrative of the arithmetic, not a quotation of anyone’s current tariff.
A paper mill draws steadily around the clock. A mall peaks in the evening and runs a generator through load-shedding. A dairy farm’s refrigeration never stops but its roof exports all afternoon. The platform reads all of them, and the meter class it assigns each one is the difference between them made explicit.
of 43 in production
rolling 90-day window
before the customer noticed
recorded 30 Jul 2026
An evening peak, plus a generator through load-shedding — grid and backup split to the unit.
Mureedkay
Grid versus generator, tracked automatically hour by hour.
Lahore
A round-the-clock production load, constant per-phase visibility.
Bhikki
A seasonal milling load metered straight off the grid.
Kamoke
Refrigeration under rooftop solar, billed net of export.
Sargodha
A multi-floor building metered separately, floor by floor.
Lahore
Refrigeration that never stops — watched for the shift that spikes it.
Kasur
Ovens and mixers across a changing shift pattern.
Lahore
Source · WattEY production database, August 2026. The profiles above are a representative sample of the fleet, described by sector rather than named: the clients are BijliBachao’s, and naming them here is a clearance question that has not been answered. Cities in service include Lahore, Sheikhupura, Kasur, Sargodha, Kamoke.
04What the system revealed
After 284 days and 1.92 GWh of real-world data, the patterns below emerged across 19 organisations in 14 industries.
These are not projections.
These are observations.
Production metrics · Aug 2026
since Nov 2025
monitored
processed daily
a dated snapshot, not live
3.7×
Peak-hour exposure varies 3.7× across sites. Same tariff. Very different behaviour.
Fleet observation · % of consumption
8.9%
Lowest
Fleet average
18.7%
32.5%
Highest
Why it matters: Two sites can look identical on a monthly bill and behave completely differently during the expensive evening window.
3 AM
Some sites draw more power at 3 AM than during their own average hour — one reaching 182.3% of its own average overnight.
Why it matters: The bill tells you what happened over the month. The curve tells you when to ask why.
2.7% → 232%
Solar performance varies wildly across the fleet. Same idea. Very different outcomes.
Why it matters: Without measuring import and export separately at the grid connection, you cannot independently verify how much the solar is actually offsetting.
96.53 kW
One site's typical draw was 62 kW — and it briefly reached 96.53 kW. 1.56× its own baseline — the ratio the alert fires on.
Typical62 kW
Peak96.53 kW
Why it matters: A short spike can set a demand charge and reveal an event a monthly bill will never show.
The interesting part wasn’t collecting two million readings. It was discovering what they meant.
Patterns
We found patterns no bill can show.
Questions
The right questions emerged from real data.
Clarity
Clarity replaced assumptions.
Impact
Better operational decisions.
Value
Real value, measurable over time.

This is what happens when infrastructure becomes an instrument for understanding.
Every figure here is measured, fleet-level and anonymised. Explore the full production dataset (open data, CSV)
A reading count on its own is a vanity number. What makes the volume mean something is what a single reading holds — enough to reconstruct the state of a three-phase supply at one instant. That is the precondition for every other claim on this page, and the reason a figure off WattEY is one you could take to a CFO or query a utility bill with, not just a number on a dashboard.
One reading · one meter
every 3 minutesMultiply by 28 streaming meters and the interval above, and the figure in the headline is just arithmetic — roughly ~9,700 readings a day.
An engineer walks the panels and writes down where the meters go and what each one will be able to see. The meter class is a consequence of that walk.
A three-phase meter goes on the service entrance with non-invasive CT clamps — no break in production. It joins the site network and starts reporting.
From the first reading the dashboard is live, and it stays live: 16 values per meter, every 3 minutes, in a browser rather than an app.
Connectivity is over the site’s own network. The meter model and the full list of supported links are not published here — they are recorded as unconfirmed in the source data, and the page states only what has been verified.
Strip away the meters and the tariffs, and WattEY is a machine for making untrustworthy, multi-source data — from devices you don’t control — safe to compute money from. Almost none of that hard part is about electricity.
It is the same problem in a dozen other places. If you have a version of it — messy inputs, real money riding on the output — that is the thing I build.
Decide what a device is from its telemetry, not from a configuration record that goes stale the day someone changes the site — so the system stays correct with nobody maintaining it.
Carry a value that can go negative all the way through the pipeline, so a credit never silently reads as a charge — the difference between a monitor and a bill.
Move with a rule set that shifts by season, tariff or contract, automatically, without asking an operator to remember to update anything.
Separate one input’s contribution from another’s automatically, so every unit has a known origin and a known cost — even when three sources feed the same line.
Wall off each party’s data from the first row, so a multi-tenant view is safe to hand a customer without a second thought.
The market view
Utilities meter the grid. Solar vendors monitor the panels. Generator vendors monitor the genset. Nobody unifies them into the one figure a business is actually billed on — the dollar view across every source. That gap is universal: grid + solar + generator under complex tariffs is how industrial power works across the emerging and developed world alike. WattEY closes it — the platform that decides the number — and the category it sits in is a $41–69B market growing double digits.
$41–69B
global energy-management market
2025 — Fortune BI / Precedence
$20.7→33.2B
industrial EMS — WattEY’s exact home
GM Insights, 2024→2034
13–15%
annual growth
Asia-Pacific the fastest-growing region
An opportunity map · not deployment
These are the markets where the same problem is most acute and buyers are actively looking, ranked by how winnable they are for a proven small player — not by raw size. WattEY is live in Pakistan today; everything below is where it could go.
Emerging-market twins — the same product, thin competition
A grid crisis drove a nationwide build-out of solar, battery and generators — and software competition is thin.
16,000 GWh shed in 2023 · ~10M prepaid meters
The highest electricity tariffs in Southeast Asia, a live time-of-use spread, and expensive diesel backup.
₱15–25/kWh diesel · English-language
The closest structural analog — time-of-day tariffs mandated by law, a vast captive-generator and C&I-solar base.
ToD mandated · 20 GW C&I solar · 81 GW captive
Generator-versus-grid is a national question. The exact problem WattEY’s generator accounting was built for.
~22M generators · grid collapsed 12× in 2024
Developed analogs — bigger, more contested, the premium horizon
World-highest rooftop solar plus a large, regulated tenant-billing (embedded-network) sector — the sub-metering use case at national scale.
Highest rooftop solar per capita · >500k embedded-network customers
A market-wide reform puts every business on half-hourly settlement by 2027 — an open education window, analytics-first entry.
MHHS mandated by 2027 · 70% smart meters
The largest, most mature C&I market on earth — and the most crowded and certification-gated. A wedge or a partnership, not a beachhead.
Demand charges = 30–70% of a commercial bill
Pakistan runs all of it at once — grid collapse, a rooftop-solar boom, diesel generators, and among the highest industrial tariffs in the world. A platform proven there is proven for the hard version of every market above. That is why the fleet is the credential, not the ceiling.
Source · Market sizing from Fortune Business Insights, Precedence Research and GM Insights (2025); per-country signals cited in docs/BB/wattey/research/02-global-opportunity.md. WattEY is live in Pakistan only — the countries above are mapped opportunity, not reach.
Plenty of hardware will read three phases and put a chart on a screen. What WattEY does that matters is turn those readings into the quantities a Pakistani business is actually billed on — the right peak window for the month, import net of export, the generator separated from the grid — and do it without asking anyone to configure it correctly.
That is a product judgement before it is an engineering one: knowing which number the director argues about, and building backwards from it. Ali took it end to end — the data model, the tariff logic, the meter classification, the dashboard a client sees — from nothing to production, in one of the hardest energy markets on earth, and it has been running since November 2025.
And what it does not do
Figures on this page are a production snapshot dated August 2026 — published as open data.
Six questions, answered the way the work was actually decided — including the parts that are still unverified and the claims this page deliberately declines to make.
The platform layer: the data model that a three-phase meter reports into, the tariff accounting that turns those readings into billable quantities, the meter-class system that decides what each site is capable of reporting, and the multi-tenant dashboard the client sees. He leads it as Head of Product & Platforms at BijliBachao.pk, where it has been running since November 2025 across 19 organisations (19 with meters installed).
Making the meter class an inference rather than a setting. The straightforward build is a configuration screen where an installer declares whether a site has solar or a generator. That is faster to ship and it is wrong within a year, because sites change and nobody goes back to update the record. Deriving the class from telemetry meant accepting a harder detection problem in exchange for a system that stays correct without maintenance.
Because otherwise it reports a number nobody is billed on. A generic energy monitor tells a site how many units it used. A Pakistani bill is computed from when those units were used, from consumption net of anything exported back to the grid, and from which source was carrying the load. The tariff logic is not a feature bolted on top of the measurement — it is the thing that makes the measurement worth taking.
The figures are a production snapshot dated August 2026 rather than a live read, though the whole site — this chapter, the Bijli Bachao hub, and the project index — was reconciled to that same pull, so they now agree. The meter model and the full set of supported network links are recorded as unconfirmed in the source data and are therefore not stated, and no generator-hours total is published because the pull surfaced none. No client is named, because that clearance has not been given.
They measure opposite halves of the same site and neither replaces the other. WattEY measures what a business pulls from the grid and what that consumption costs under the tariff. Solar Performance Cloud inspects what the site’s own solar generates, string by string. Ali built and leads both, which is the point: the two chapters are one argument about being able to take a measurement problem end to end.
Most of it. The electricity is domain detail; the engineering is about making third-party device data safe to compute money from — classifying assets from their own behaviour rather than from a stale configuration record, keeping a signed quantity signed all the way through, applying a rule set that changes on a calendar without asking an operator to remember, and isolating tenants from each other by default. That is the same problem in logistics telemetry, in metering water, and in any platform whose output an accountant will eventually have to defend.
Because one monthly number hides three things it cannot separate: how much of your consumption landed inside the expensive peak window, how much your rooftop solar actually offset at the grid connection, and how many units your generator burned versus the grid. WattEY measures all three directly — a three-phase reading every three minutes — so the bill stops being a surprise and becomes a set of quantities you can watch move through the month.
You need the generator’s energy measured separately from grid energy, which almost no site does. WattEY detects generator runs automatically and keeps backup energy on its own ledger, so the units it produced can be set against the diesel you bought — and against grid units over the same period. Without that separation the comparison is a guess; with it, it is arithmetic.
WattEY is built and deployed by BijliBachao.pk, the engineering firm where Ali built it, and it runs live across industrial and commercial sites in Pakistan today. An operator who wants it on their own fleet goes through BijliBachao; this page is a case study of the system and the engineering behind it, not a product store.
Figures in these answers come from a WattEY production snapshot dated April 2026, and the page says so wherever it states one. The same questions and answers are served as structured data and in this page’s plain-text and Markdown views.